Evaluating investments in isolation is insufficient. Understanding how different assets move in relation to each other—through correlation—is essential for smarter portfolio construction and risk management.

Analysing an investment in isolation isn't sufficient; comparisons with other investments or benchmarks are essential for a more comprehensive evaluation.
Correlation is crucial for recognising how different investment strategies or asset classes interact over time, influencing portfolio optimisation.
The correlation coefficient quantifies the strength and direction of the relationship between two investment variables, providing a clearer insight into their interdependencies.
Correlation between investments can vary over time and be influenced by changing economic conditions and market dynamics, highlighting the need for adaptive investment strategies.
Diversification is not just a strategy but a necessity to mitigate risks and enhance potential returns by spreading investments across various assets.
When analysing data—whether financial or otherwise—analysing it in isolation rarely gives you the whole picture. For example, knowing the average return on one investment strategy tells us what return we might expect going forward (keeping in mind that past performance does not guarantee future results). However, to adequately assess whether an investment is good or bad, we need to compare it to another investment strategy or, at the very least, have a benchmark against which to measure.
And in most instances, we need to take our analysis one step further by understanding the interplay between two types of investments or data series. That's when correlation becomes crucial. In simple terms, correlation measures how two variables move relative to one another in a given time period, i.e., how they "co" relate over time.
Any investor seeking to optimise their portfolio should have a solid understanding of what correlation means. Hence, to ensure that you are equipped to make the right investment choices, this article provides a beginner's guide to correlation, starting with conceptual exploration.
What is correlation?
When it comes to correlation, the question we are trying to address is: If x drops, how much does y move, and in which direction?
In the context of investment portfolios, the central question we're exploring is: How does the return of one asset (or investment) move relative to the return of another asset? That is, if one increases, does the other decrease? Or increase?
As we covered in 'Diversification is the only free lunch,' placing all of our eggs in one basket may not yield the desired return, nor is it advisable. Hence, we need to spread—or diversify—our investment across several assets.
To make an informed decision about how to diversify, we need to understand not only how investment strategies move but also how they move relative to other investment strategies or asset classes.
How do we measure correlation?
When discussing correlation in the financial market, we often refer to the correlation coefficient.
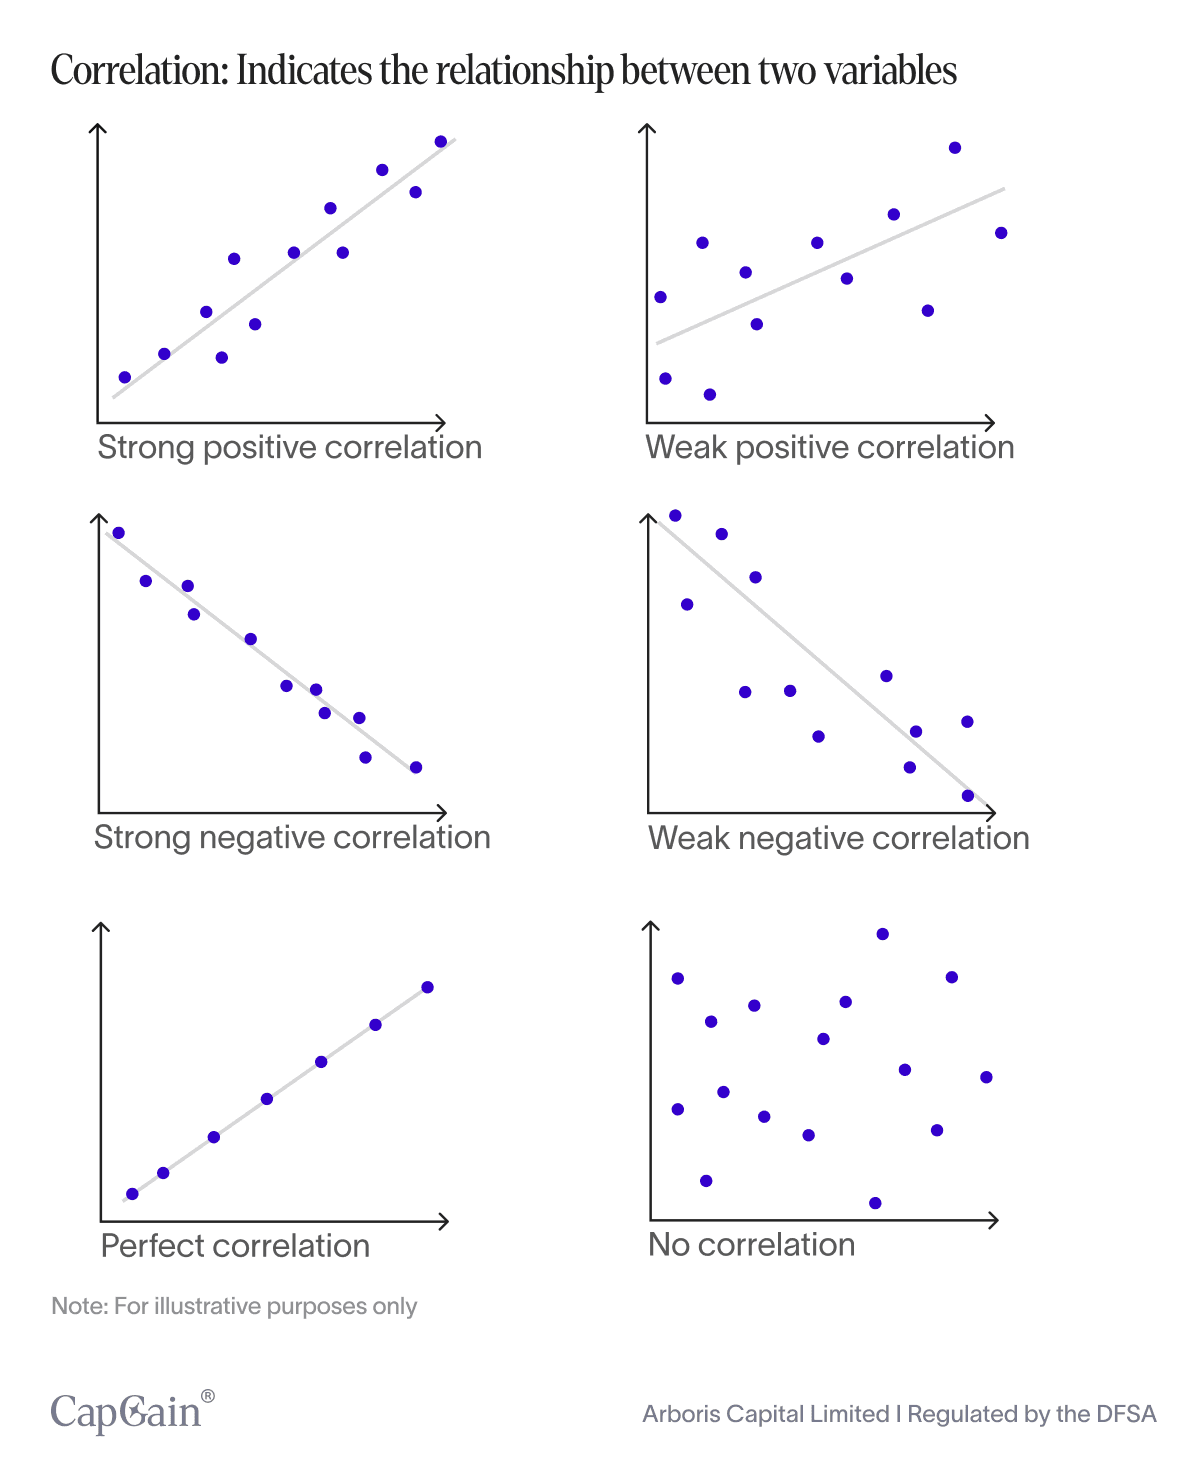
The correlation coefficient is a standardised measure that quantifies the degree of correlation. The coefficient can range from:
+1, indicating a perfect positive correlation where both variables move in the same direction.
-1, indicating a perfect negative correlation where the variables move in opposite directions.
Values near 0 indicate a weak or no linear relationship between the variables.
Correlation does not equal causation
Before we proceed, it is important to note that correlation does not imply that the two variables are interrelated.
Going back to the previous question (if "x" goes down, what happens to "y"?) Let's assume that when "x" goes up, "y" also increases. This means they are positively correlated. It does not imply that "x caused y" (or that "y caused x" for that matter).
For example, the returns of bonds and stocks are correlated. Meanwhile, that does not imply that bonds increase because stocks increase, nor does it imply that an increase in bonds leads to an increase in stocks. In statistics, we say that “correlation does not equal causation”. By analysing the correlation, we are simply acknowledging that sometimes variables move in the same or opposite direction.
Sometimes this reflects the fact that these variables are influenced by the same factors. E.g., since stocks and bonds are influenced by the same macroeconomic factors (inflation, the job market, and interest rates) they are bound to exhibit a degree of correlation. Similarly, in a given year, the harvest of apples and oranges within a region will inevitably be affected by some of the same factors, i.e., weather conditions and soil composition. That doesn’t mean that a higher yield of apples leads to a higher yield of oranges.
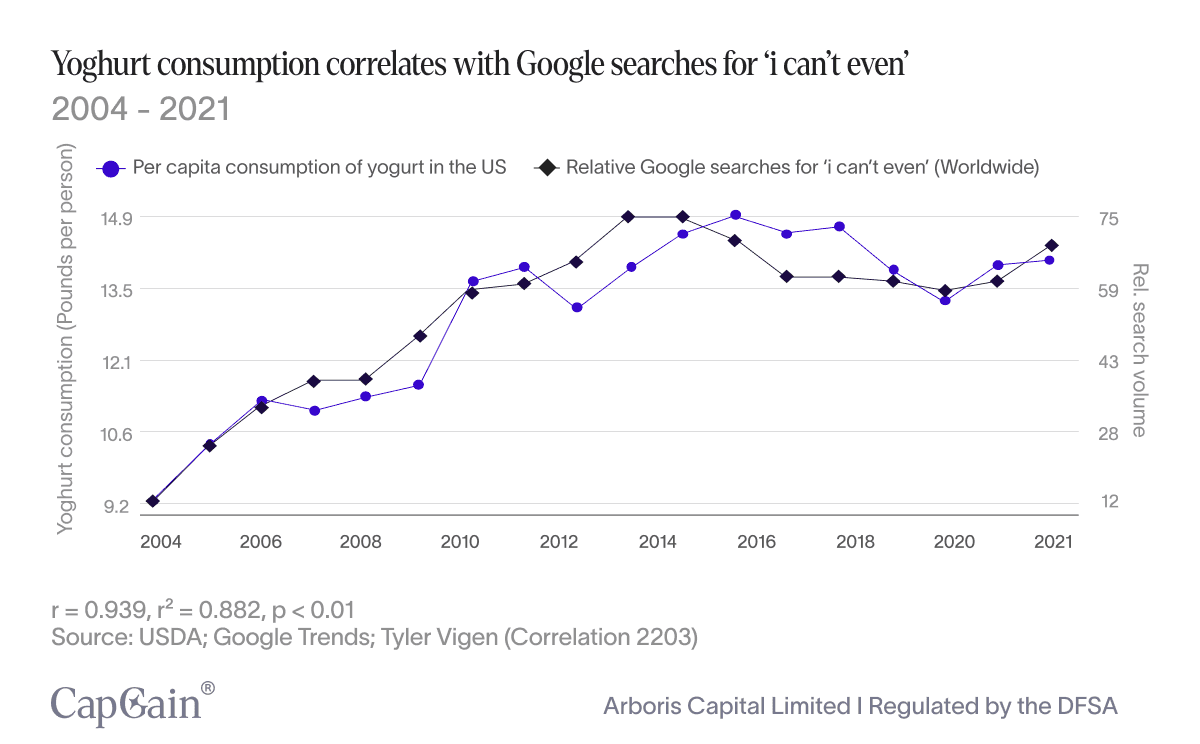
And sometimes, it’s a pure coincidence, meaning there are no underlying factors explaining why these variables correlate. We call this spurious correlations.
Spurious correlations
In his book Spurious Correlations (and its accompanying website), 1,000 Tyler Vigen compiles a wide range of bizarre correlations, showcasing how completely unrelated data sets can appear to be linked when, in fact, they are not¹.
'It's all connected'
In the context of financial markets, correlations are rarely coincidences. Bonds and stocks are integral to a financial system, which is a component of a national economy, which in turn is part of a global economy. All of these are highly interconnected.
Some factors positively influence stocks and bonds, but have a greater influence on stocks than bonds, and vice versa. Other factors have a negative impact on stocks but positively influence bonds, and, again, vice versa.
The correlation between stocks and bonds—and any other variables— seeks to provide us with a standardised measure of how—and by how strongly—they move in relation to one another within a given time period, taking all these factors into account.
Time matters: Correlation isn’t constant
This leads us to the next point: time. The correlation between two variables measures how they "correlate" within a given timeframe. Like any other statistic—i.e., average, median, standard deviation, IRR—correlation is not a fixed number or a universal truth. It depends on the time period during which the data was collected. For instance, the average daily temperature is higher in the month of June than it is in December (provided that you are somewhere in the Northern hemisphere).
Since correlation is calculated from a series of data points observed within a given period, the result depends on the time frame. This reflects the fluctuating nature of financial markets and the impact of various external factors on asset classes. Thus, while a correlation coefficient provides a snapshot of interdependence, it is essential to consider that this figure can change as new data emerges and conditions evolve.
Stocks and bonds: A shifting relationship
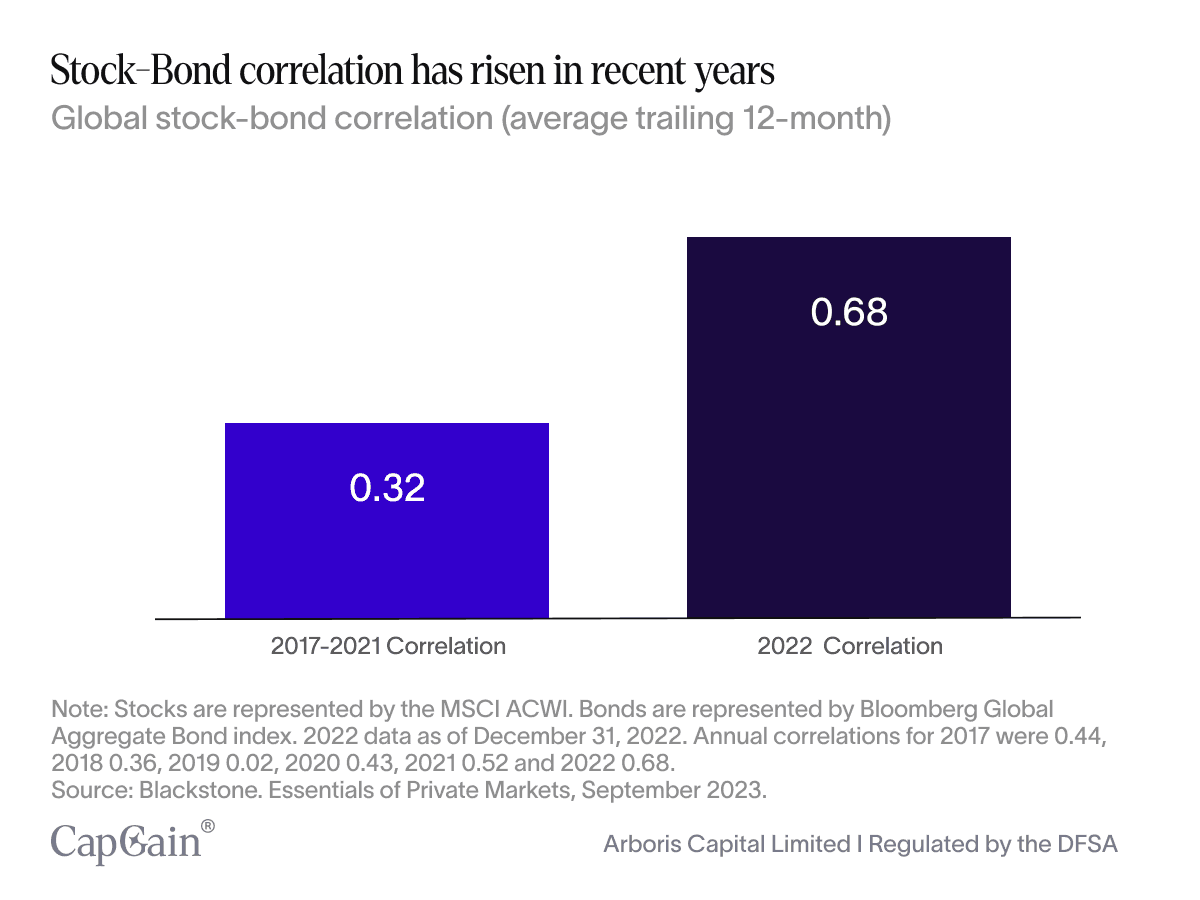
For example, stocks and bonds have historically had a low correlation, meaning they did not move much relative to one another. This made them a great hedge for one another. If one decreased drastically, the other wouldn't drop by as much.
Meanwhile, in recent years, stocks and bonds have become more correlated. According to Blackstone, the global correlation between stocks and bonds from 2017 to 2021 was 0.35, which is considered moderate in the market. Meanwhile, in 2022, the correlation nearly doubled to 0.68².
This means that if stocks decline, bonds decline more now than in the past. Again, decreases in stock prices do not cause bonds to decrease. Rather, they are more likely to move in the same direction and at a greater rate than in the past.
Investor implications
What does this mean for you as an investor? Well, if you’ve made it this far, you’ll hopefully understand the importance of doing your research and adding correlation to your list of considerations.
A vital tool in this context is the correlation matrix. A correlation matrix is a table that shows the pairwise correlations between multiple variables. It gives you a quick overview of how strongly—and in what direction—each variable is linearly related to every other variable.
Each cell in the matrix shows the correlation coefficient between two variables. You’ll notice that the diagonal always shows 1. That is because each variable is perfectly correlated with itself.
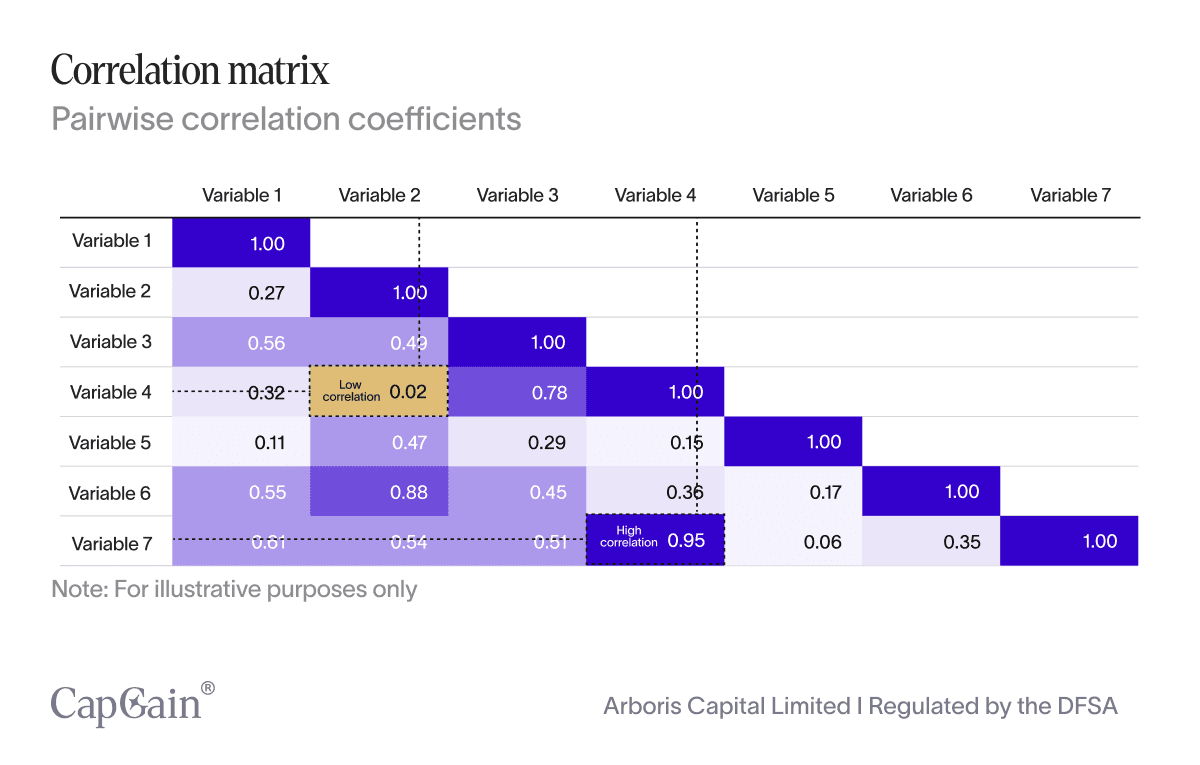
In this specific matrix, the highlighted cell (Variable 4 vs. Variable 7) shows a very high correlation of 0.95, indicating these two variables move closely in tandem. Conversely, the lowest correlation (Variable 2 vs. Variable 4: 0.02) suggests no meaningful linear relationship between those two variables.
To help contextualise correlation dynamics, let’s look at a stylised example of a correlation matrix.
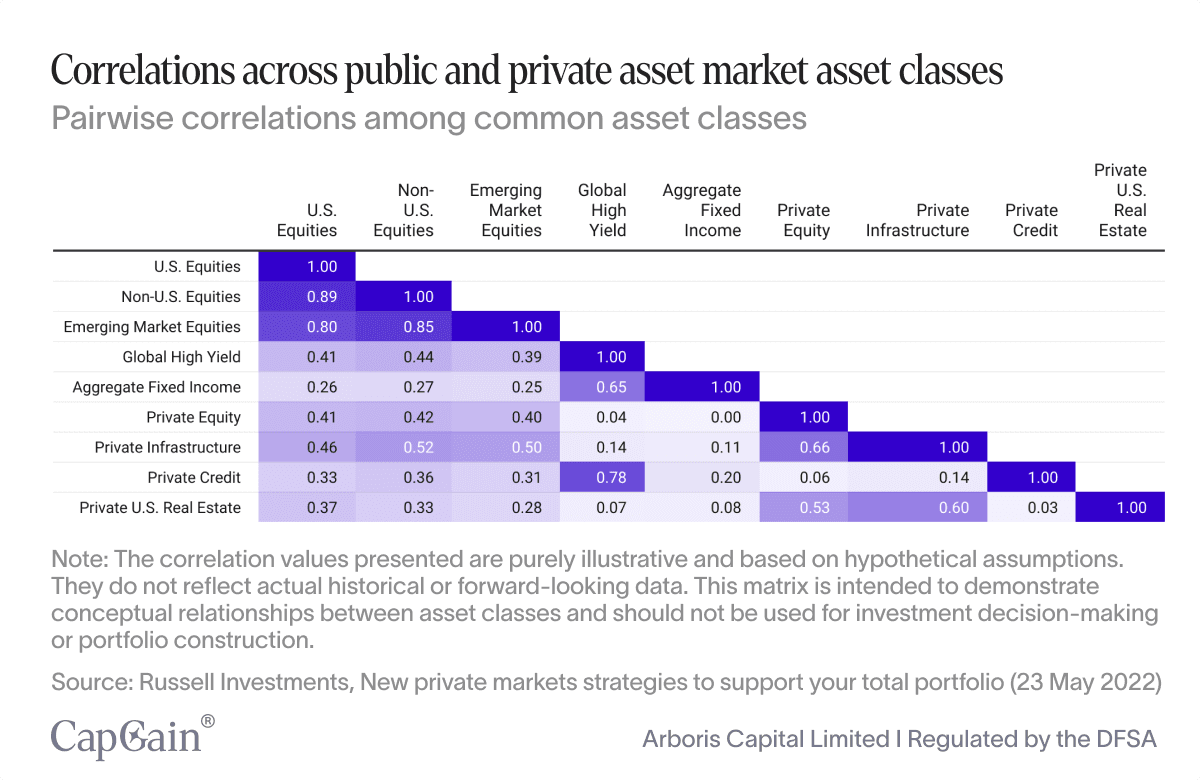
In this hypothetical scenario, you’ll notice that U.S. equities are highly correlated with non-U.S. and Emerging Market Equities, suggesting that in some cases, geographically distinct markets sometimes move in tandem due to shared global drivers (like interest rates or investor sentiment). Meanwhile, asset classes such as private credit (e.g., 0.33) or aggregate fixed income (e.g., 0.26) exhibit comparatively lower correlations with U.S. equities in this example, potentially offering more meaningful downside protection³.
Final thoughts
In an era marked by heightened volatility and interconnected markets, understanding how asset classes interact is more than just a technical detail—it’s a lens through which investors can better navigate complexity. While correlations are not static and do not equate to causation, they can offer a useful framework for thinking about portfolio construction under different market regimes.
Sources:
Tyler Vigen Spurious Correlation #2203, Yoghurt Consumption Correlates with Google searches for ‘I can’t even’, Accessed July 14, 2025. https://www.tylervigen.com/spurious/correlation/2203_yogurt-consumption_correlates-with_google-searches-for-i-cant-even
Blackstone, Essentials of Private Markets (Sept 2023), Accessed July 14, 2025. https://pws.blackstone.com/emea/wp-content/uploads/sites/20/blackstone-secure/Essentials-of-Private-Markets-Brochure.pdf?v=1745325977
Russell Investments, New private markets strategies to support your total portfolio (23 May 2022), Accessed July 14, 2025.
https://russellinvestments.com/nz/blog/private-markets-total-portfolio-strategies

Written by
Sarah Hansen
Head of Research
Disclaimer – For Professional Clients Only
This communication is intended solely for persons classified as Professional Clients as defined by the Dubai Financial Services Authority (DFSA). It is not directed at Retail Clients and should not be relied upon by any person who does not meet the criteria for classification as a Professional Client. The information provided herein is for general informational purposes only and does not constitute, and should not be construed as, an offer, solicitation, invitation, or recommendation to buy, sell, or otherwise transact in any investment product or to engage in any investment strategy.
The subject matter discussed does not relate to a DFSA-regulated financial product or service. The content is intended only to provide a general update on market conditions and does not consider the specific investment objectives, financial situation, or particular needs of any recipient. It should not be relied upon as the basis for any investment decision. Past performance is not a reliable indicator of future performance. The value of investments and any income from them may fluctuate, and there is no assurance that the original capital will be preserved or returned.
Although the information contained in this communication has been obtained from sources believed to be reliable, Arboris Capital Limited makes no representation or warranty as to its accuracy, completeness, or fitness for any particular purpose. No liability is accepted by Arboris Capital Limited, its employees, or affiliates for any direct or consequential loss arising from the use of or reliance on this material. Arboris Capital Limited is authorised and regulated by the Dubai Financial Services Authority (DFSA) and operates within the Dubai International Financial Centre (DIFC), United Arab Emirates.


